UX Research & Design
Coffee Carbon Collective
Tools
UX Research: Figma, Sketch, Adobe XD, SurveyMonkey
UI/UX Design: Figma, Adobe XD, Adobe Photoshop, Adobe InDesign
Agile-React Team: Slack, GitHub, Miro Board, Microsoft Teams, Zoom
COFFEE CARBON COLLECTIVE
The Team
Cansu – UX Designer & Researcher & ReFi enthusiast
Eren – Front-End Developer
Attila – Back-End Developer
Ponraj – Climate Adaption Specialist
Darina – Enterpreneur in coffee / AI / Web3 Berlin Lead
What We Build
Details of the Collective
“Rising temperatures will reduce the area suitable for growing coffee by up to 50% by 2050. Producers are willing to transition to regenerative practices to mitigate their climate risks, but they don’t have sufficient resources to invest in their farms and survive the harvest volume drop during 4-5 years of transition.”
Source: Inter-American Development Bank
https://www.iadb.org/en/improvinglives/most-unexpected-effect-climate-change#:~:text=Rising%20temperatures%20will%20reduce%20the,become%20hospital%20to%20the%20crop.
Coffee Carbon Collective (CCC) supports coffee farmers in transitioning to agroforestry by providing tools for pre-financing and direct trade with climate-conscious coffee buyers. Final delivery was:
Surveys, Personas, .KML files of farmer lands, Wireframes, Prototype, PPTx of Hackathon Roadmap
Methdology
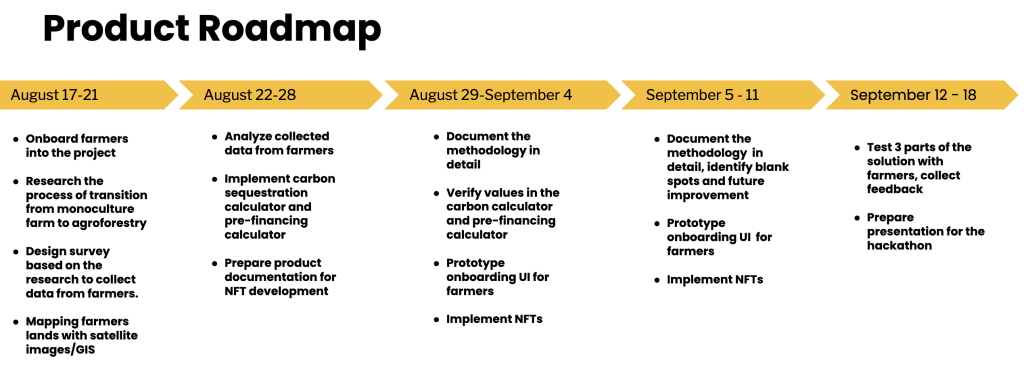
Creating the Roadmap
We started with organising weekly meetings.
1. Research
We conducted surveys to firstly understand and analyse the needs of farmers and how our product can help them.
1.1. Survey Methodology
– Field work with more than 50 farmers in Colombia, Costa Rica, Guatemala, Brazil
– 25 face-to-face interviews at the World of Coffee
– Coffee & Carbon ecosystem partner interviews
– Online surveys though SurveyMonkey
From the Survey we aimed to learn about:
– size of the farms (results: ranging from 30 ha to 200 ha)
– varierities of trees (these are needed in the calculation, how much and which types of trees we will need to plant)
– fertilization programs
– farming practices
– productivity of the farms
– their current distrubition and progress
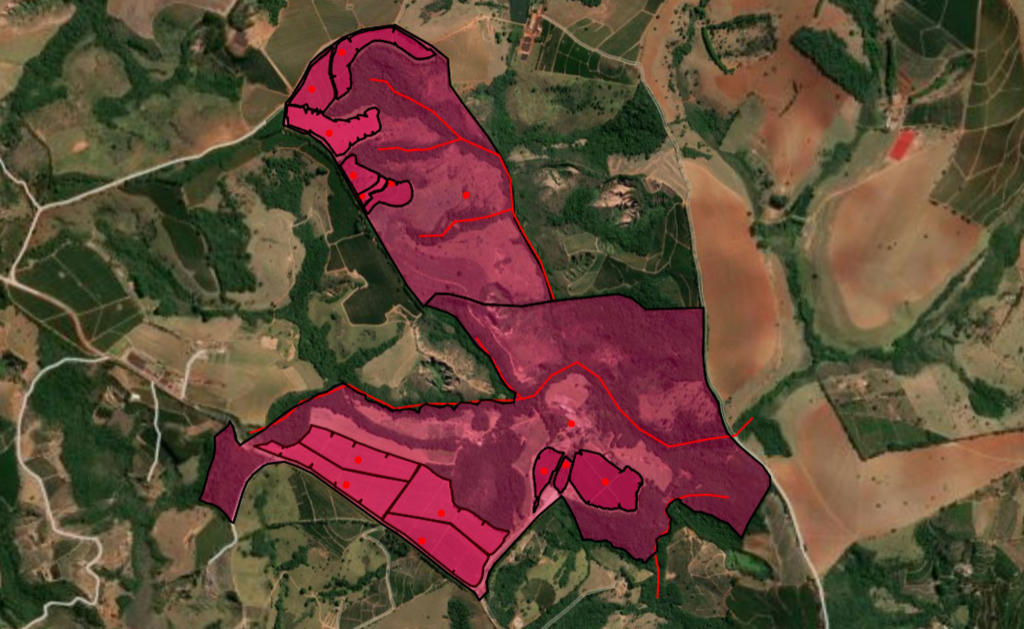
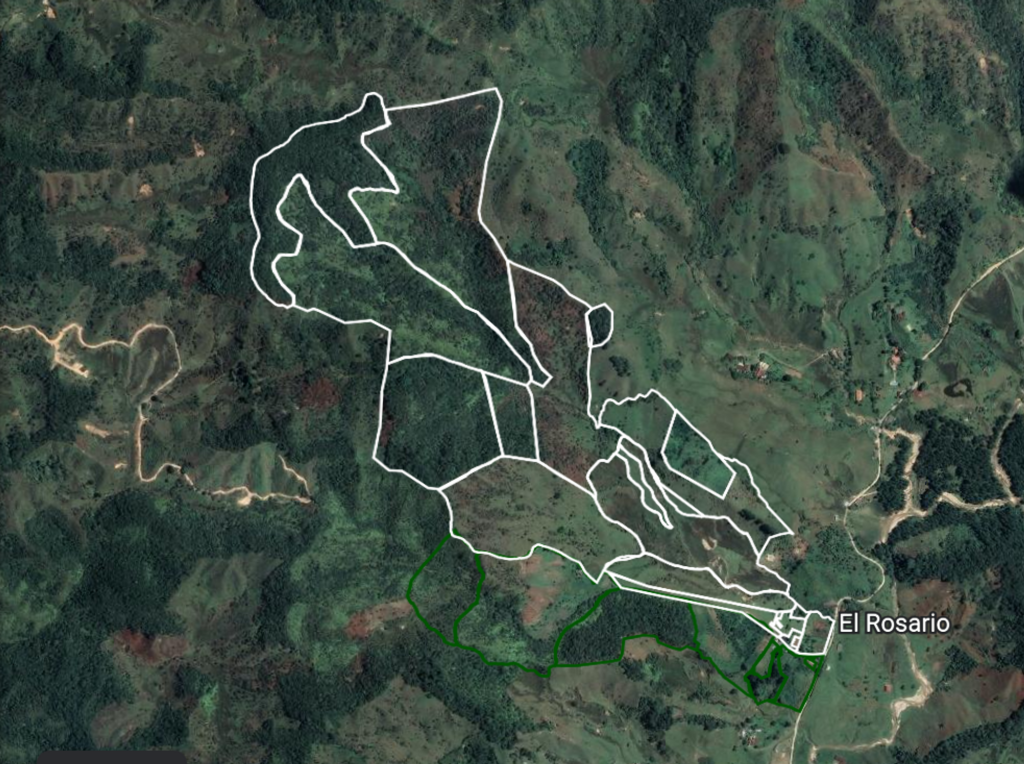
Data collected through a survey and .kml files allowed us to estimate carbon stock and carbon emissions per farm for the sake of the demonstration during the Hackathon.
1.2. Analysing Survey Results
100% of coffee farmers suffer from climate change already now (drought, shifting seasons, pest & diseases). 2 of the online surveyed farmers managed to deliver their .kml files for our prototype. Finding their .kml files is one of the painpoints for farmers.
100% of coffee farmers suffer from climate change already now (drought, shifting seasons, pest & diseases).
93% interviewed coffee farmers recognize the need to transition to regenerative agriculture and consider agroforestry the one of the viable solutions.
Transition to agroforestry takes 4-5 years, requires financial and human resources. Crop volume drops short-term, and farmers need to have security of revenues.
Right now smallholder farmers (3-5 ha) are not able to get certified to sell carbon credits (certification cost 50k and financially feasible for 1000ha farms).
Smallholders are ready to act, but absence of pre-financing tools and safety nets stops them from switching to regenerative agriculture and sequestering carbon at their farms already now!
2. Planning
Climate change could potentially have an impact on coffee production as well as coffee production contributes to climate change. Consequently, the coffee sector is interested in climate-friendly coffee production with possible adaptation/mitigation strategies, which could help increase productivity and reduce emissions.
The standing carbon stocks in the production systems and the product carbon footprint measure the greenhouse gas emissions per unit weight of coffee produced.
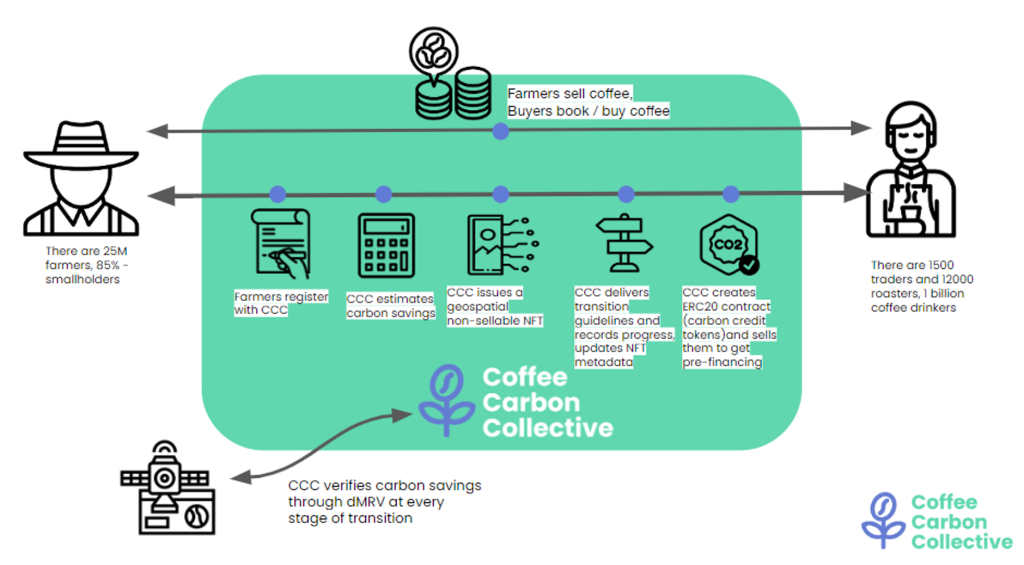
We started with defining the product vision, goals and roadmap.
2.1. Estimation Model
The model we intend to develop would estimate carbon emissions and carbon stock from coffee production with agroforestry plantations. A potential decision support system for a climate-friendly coffee production system comes with estimating carbon stock and emissions from the production system.
2.1.1 Carbon stock estimation:
i) Collection of species information from agroforestry plantations in the coffee fields will be
collected from field visits and farmer’s interviews
ii) We will collect information on tree plantations and coffee plantations, such as tree density,
canopy height, co-product density, and plant density, from farmer’s interviews and high-
resolution satellite images from our partners.
iii) Allometric equations (i.e., Segura et al., 2006) will be used to estimate above-ground biomass and specific gravity, which will be converted as carbon stock with the scale factor.
2.1.2 Carbon emission estimation:
i) Data for estimating carbon emissions, mainly farm inputs for coffee production, such as
fertilizer, and pesticides, weeding practices, land use practices, and productivity, will be
collected from farmer’s interviews.
ii) Climate data will be collected from satellite observations (i.e., CHIRPS and CHIRTS), which will be used to develop an emission model with other farming inputs
iii) Inputs will be used to develop models (i.e., multi-linear regression models) from emission data from research articles, CFT outputs, and satellite data.
Value added outcomes of this methodology:
Adopting an optimal level of inputs is a must in reducing emissions and keeping/increasing productivity steady in the climate change scenario. A yield model could project productivity in climate change scenarios with the given inputs. A yield model could facilitate suggesting optimal input levels for increasing/steadying the productivity in the climate change scenario with reduced emissions.
The methodology for step-by-step estimating carbon stock and emission:
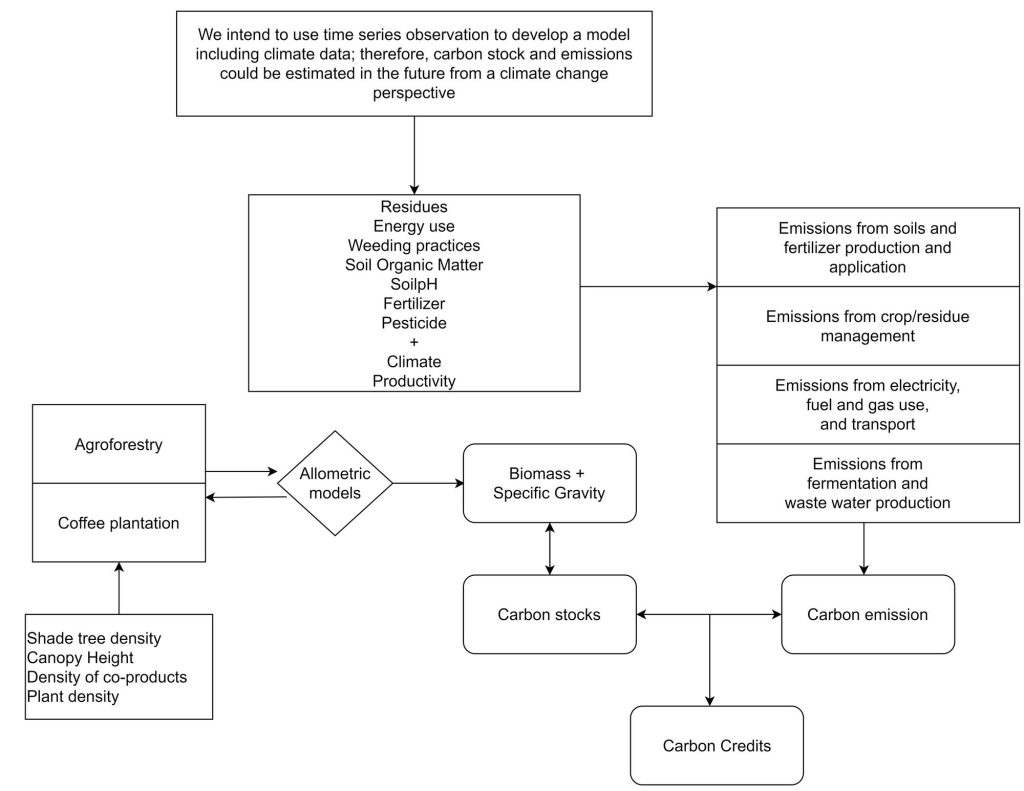
In the next stages, we intend to develop a Coffee Carbon Credit tool to estimate carbon stock and carbon emission under various agroforestry systems and calculate the amount of carbon credits.
2.2. Developed a Calculator
Our team developed a calculator based on all the information we have collected.
2.3. Defined Tokenomics
NFTs & Tokens:
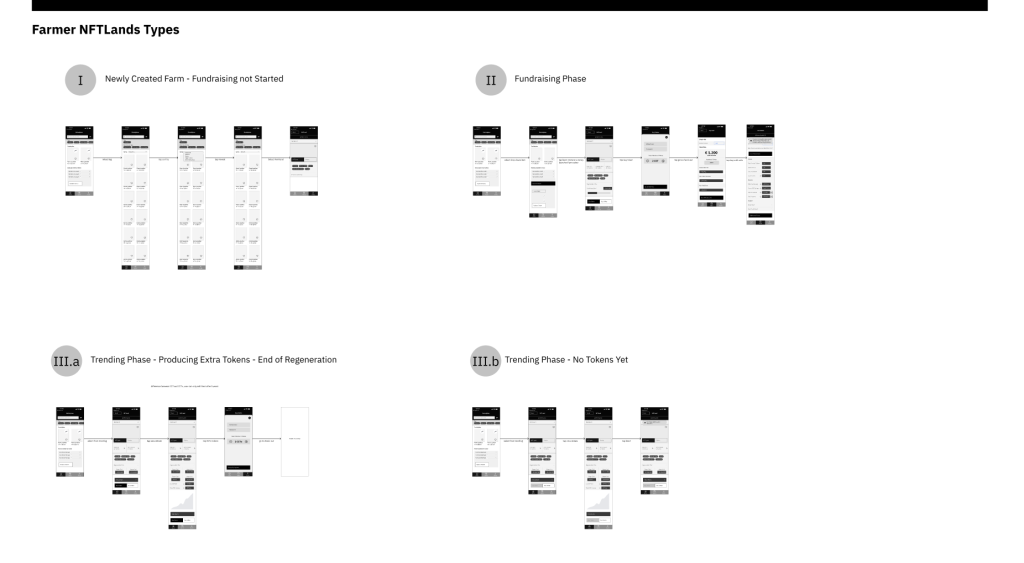
- Geo-spatial NFT that represents a farm regeneration diary, non-sellable. They contain the most important information about the farm and get updated as soon as MRV is done
- ERC20 tokens that represent 1 CO2 ton + biodiversity and social impact in the area
- CCT (Coffee Carbon Ton) tokens are minted at the beginning of regeneration by a farmer to fundraise and pre-finance the regeneration of the farm. Because funders of these tokens will only be able to use carbon credits 5 years after the first credits are issued (it takes time for the trees to grow and develop). These credits are sold to the funders with a 40% discount because they bear the risk of regeneration.
- CCTx (Coffee Carbon Ton Issued) tokens are minted after 5 years of regeneration to create additional revenue for farmers. Funders of these tokens can use them immediately and bear no risk of regeneration, they pay the full price for the tokens.
3. Design
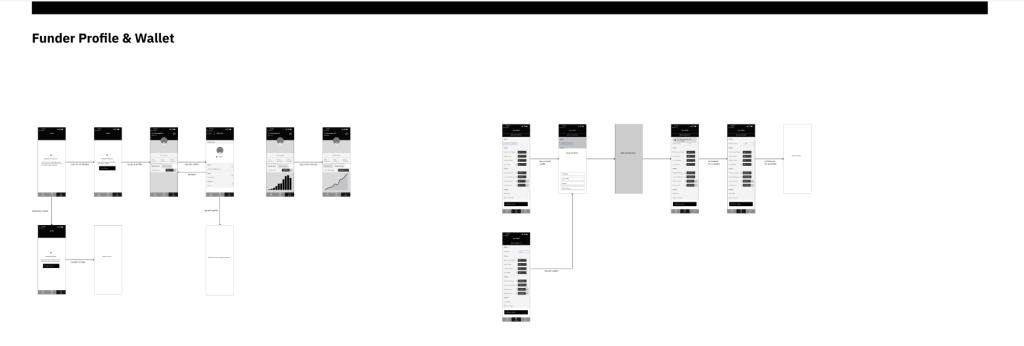
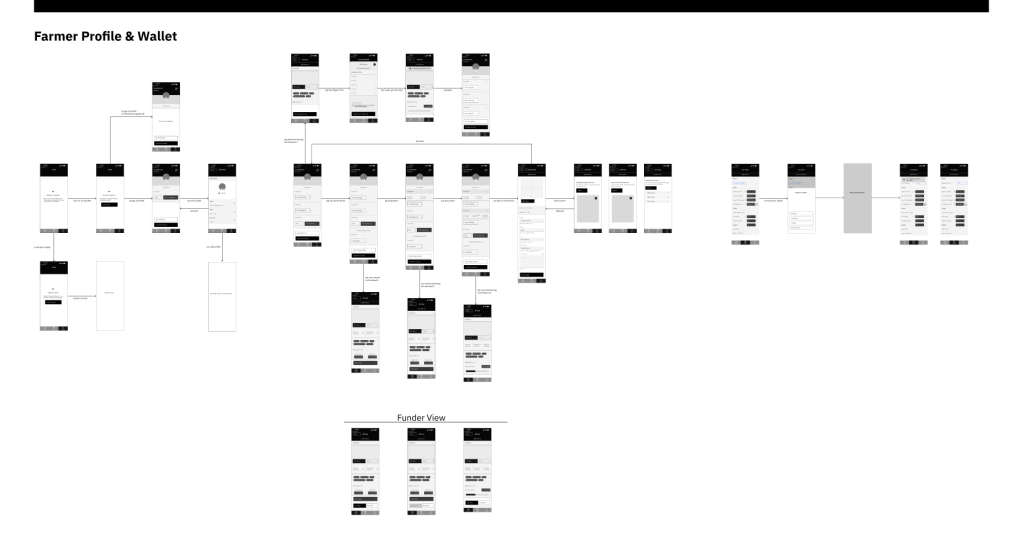
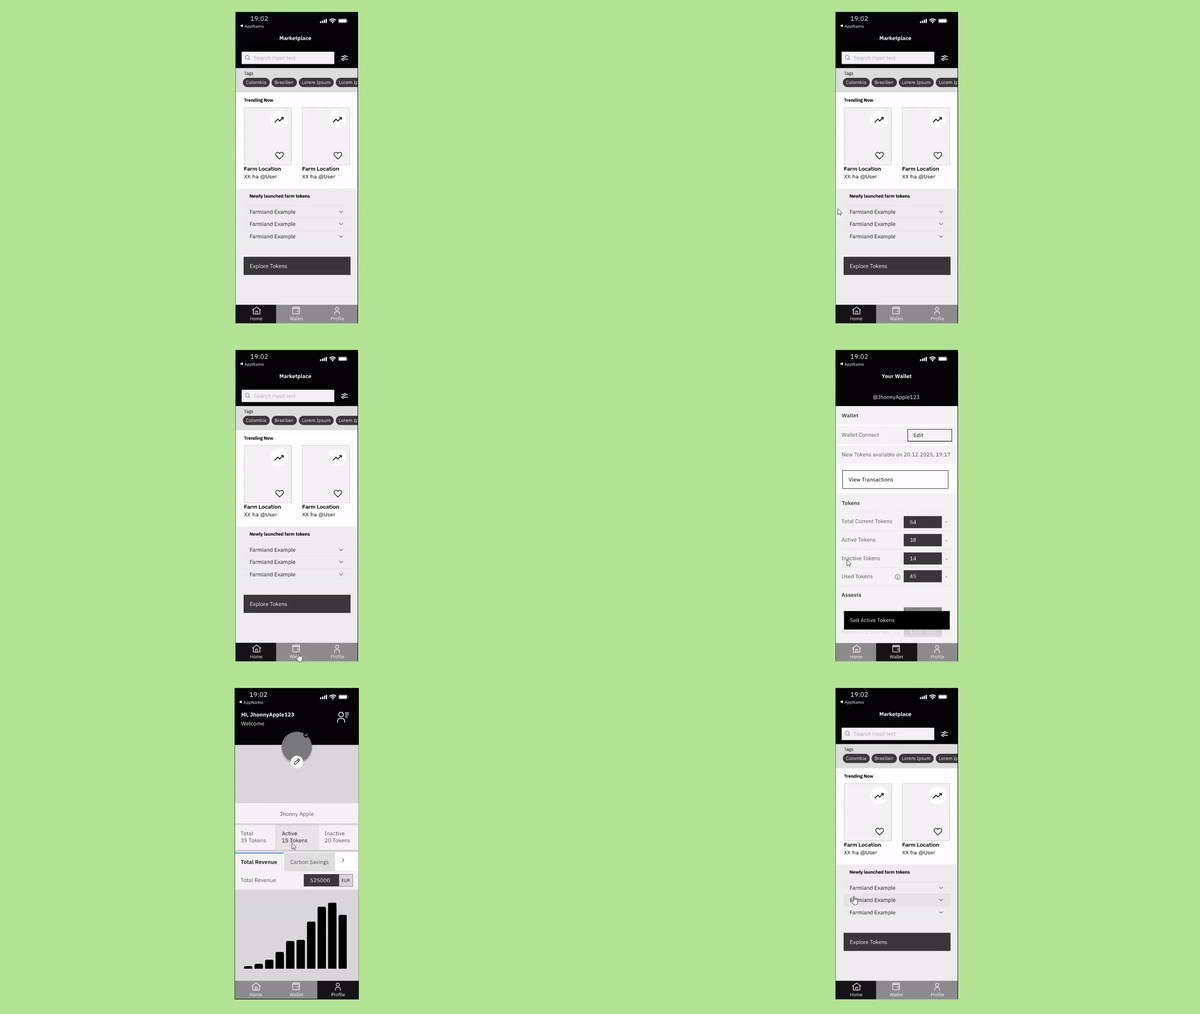
3.1. Wireframes
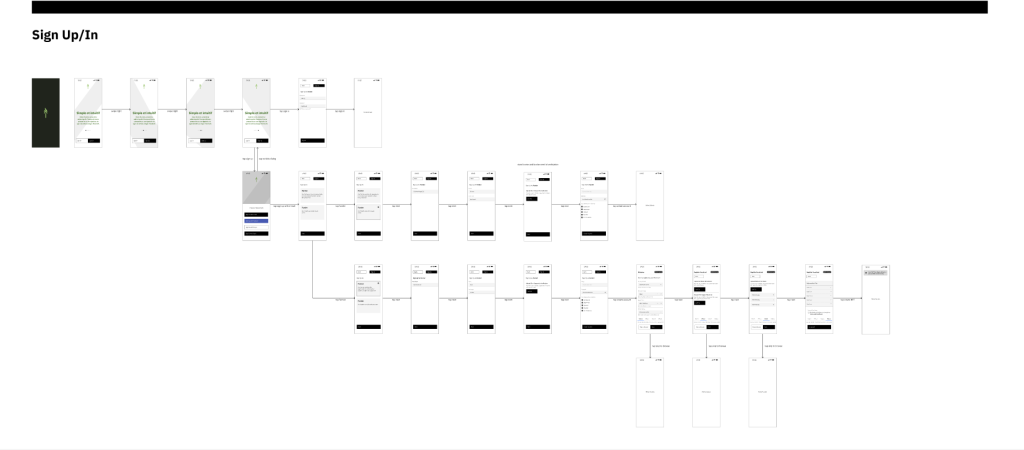
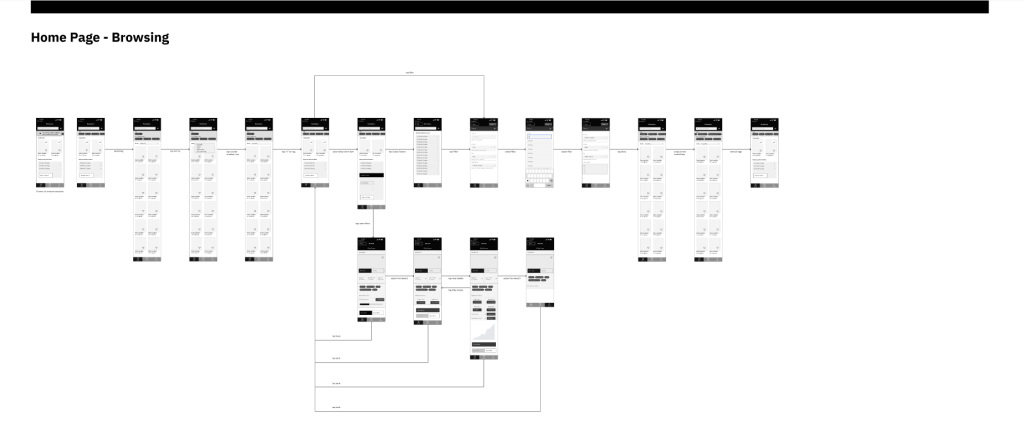
As a next step, I created wireframes to finally create an app that reflects our vision & goals, backed by the research and analysis we did so far.
I started with transferring the calculations we were doing to the application interface with Fitt’s law and Hick’s law in mind. We needed clear affordances & signifiers to make this complicated process as simple and as clear as possible for the farmers.
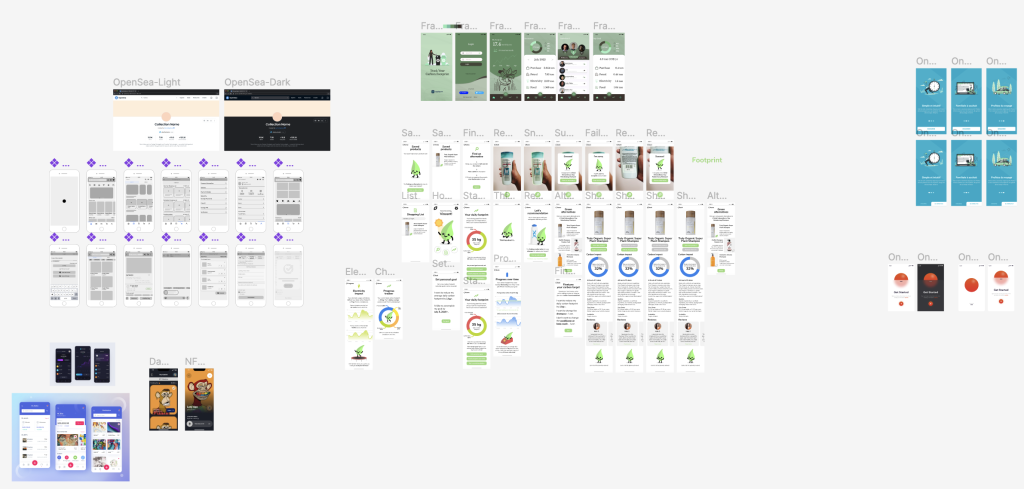
I started with creating a component library and evaluating other carbon app examples.

